Today, in addition to reports from the field workers and ground surveys, estate managers can make use of drones for mapping and monitoring of their estates. However, with more data, each with its own data management and analysis processes, it becomes increasingly difficult for estate managers to put all the information together and make sense of them to get a holistic view of what’s going on in the estate.
Get your estate managers to plot problems on the map
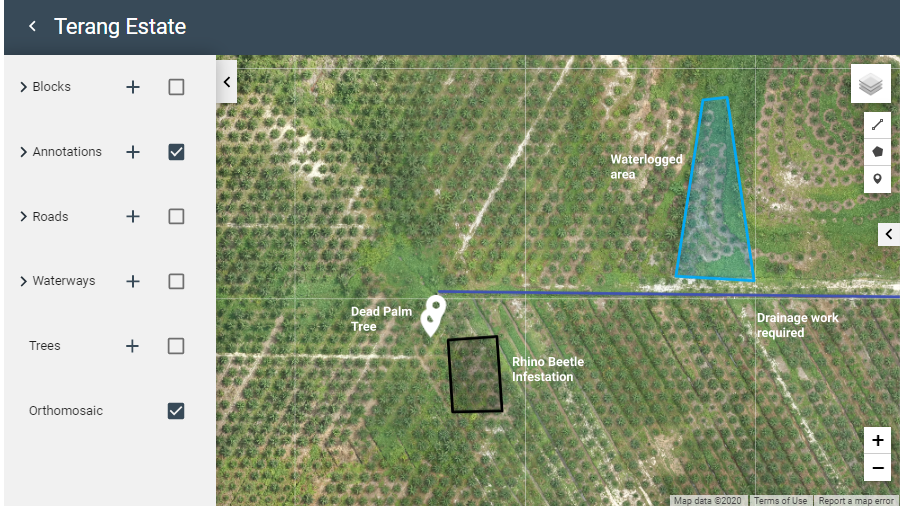
To help solve this issue is one of the reasons why we built Plantation 4.0. One of the core features of Plantation 4.0 is that you can add your own custom annotations to your drone maps. This would allow you to “pin” reports from the ground onto where they are located on your estate as represented by the map. There are two main reasons why this would be useful.
Firstly, this would allow you to quickly figure out which area in your estate is having more issues and thereby you can focus more of your attention and resources there. Another reason is that this allows you to more easily relate how the different reports relate to the actual ground and to each other and thereby uncover useful insights.
Identify relationships & patterns from map
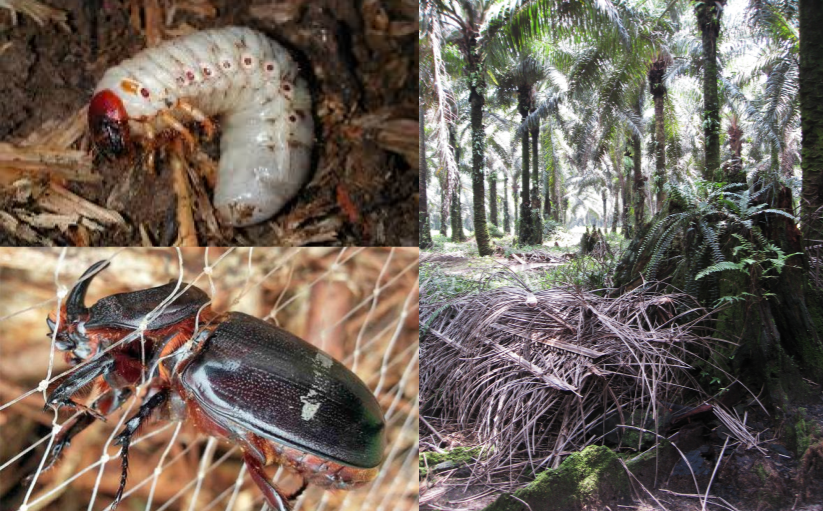
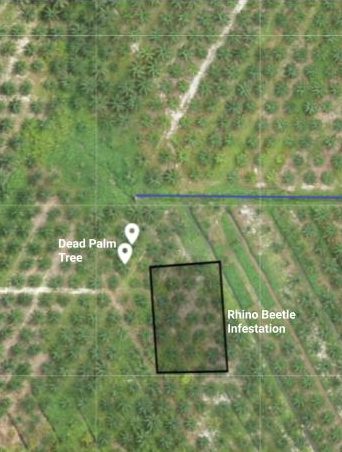
For example, in the case illustrated below, a rhino beetle infestation is being reported next to some dead decaying oil palms. This can quickly prompt the estate manager to suspect the infestation may have come from the decaying palms and alert his teams to investigate.
Plotting issues in an app might be new to you or your Estate managers. We have made it very easy, why don’t you give it a try? Signing up for Plantation 4.0 is totally free. Learn to run your plantation in a data-rich geo-centric environment and like our Facebook page to be notified of our next update!